LUHMAN 16 / SUBSTELLAR DOSSIER

Luhman 16 B

6.50 light-years from Sol

Broken clouds reveal warmer layers in a nearby world with no solid surface.

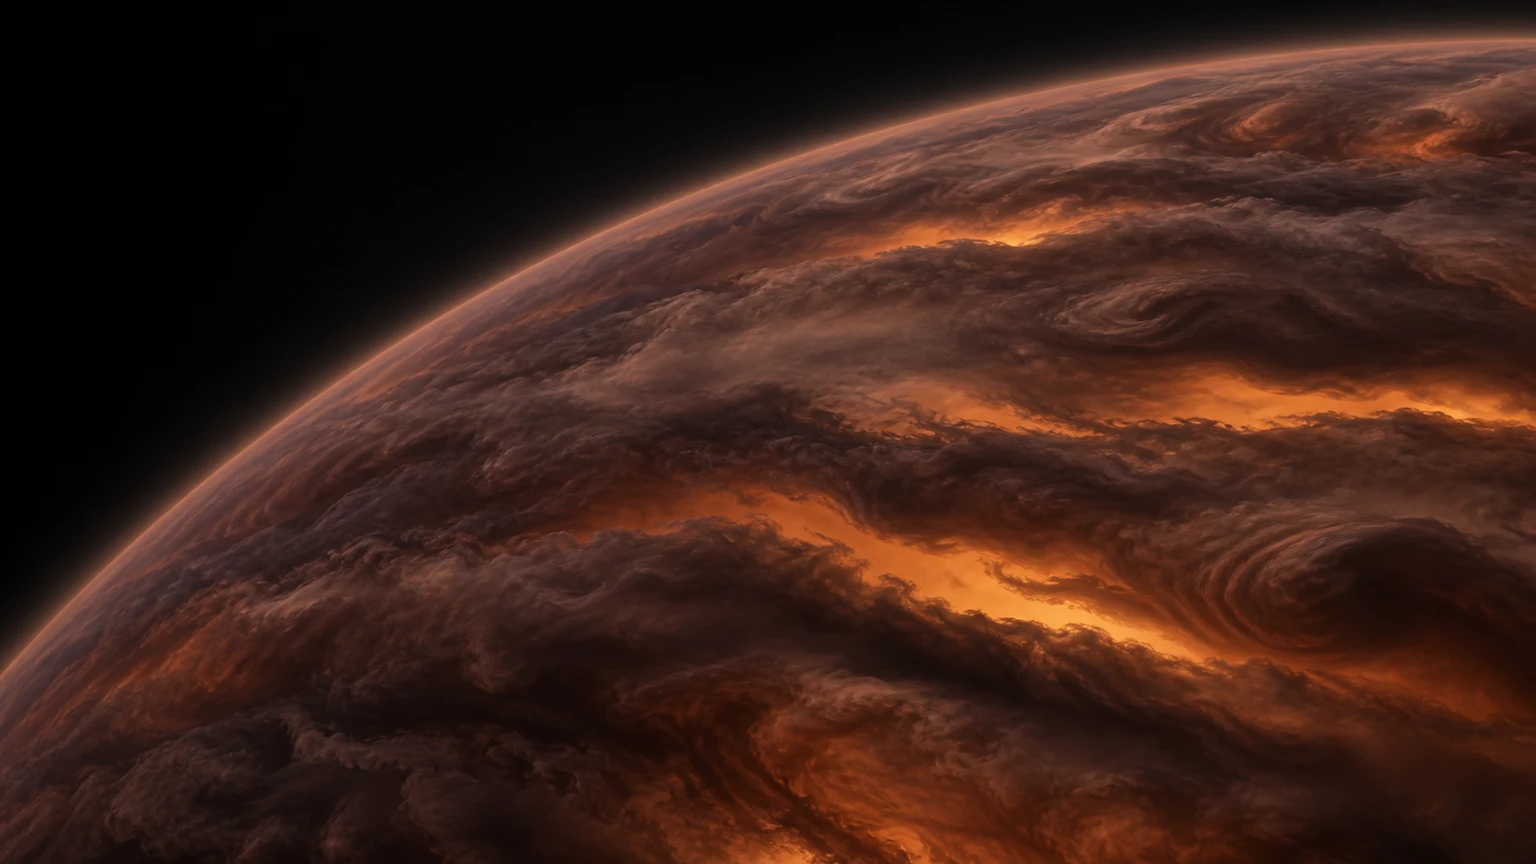
Artist’s impression of Luhman 16 B
T-type · brown dwarf

A weather map written in changing light.

Atmospheric conditions ↗

02
EFFECTIVE TEMPERATURE1,280 K

Cooler than a star. Still searing.

Luhman 16 B1,280 K
Sol5,770 K
Shared scale 0–10,000 K · effective, not core temperature

Evolution ↗

03
CURRENT PHASE

A cloudy world losing heat.

  1. ENERGYStored internal heat
  2. NOWCloudy atmosphere
  3. OUTLOOKCooling and fading
Brown dwarfs cannot sustain core hydrogen fusion like Sol. This describes their gradual cooling, not a stellar giant-stage sequence or a countdown.

Companion system

04
An imagined view of patchy cloud cover with warmer atmospheric layers visible through openings. Research supports brightness variations and cloud structure, not this exact arrangement. Color and exposure are illustrative.Windows into warmer depths ↗ ARTIST’S IMPRESSION · 3 VIEWS

Diameter comparison ↗

06
≈ 0.1 × Sol
LUHMAN 16 B

Instrument detail

Artist’s impression of Luhman 16 B

Artist’s impression · structure and color are illustrative.

A map made without a close-up camera.

Astronomers used changing spectral lines as Luhman 16 B rotated to reconstruct large bright and dark regions. The result was an early weather map of a brown dwarf. It did not resolve individual clouds like a spacecraft camera would. Instead, the map inferred which broad regions contributed different amounts of light as they turned into view.

A gap can make a cool world brighter.

A thinner cloud layer can expose deeper, warmer gas. That helps explain why B can outshine A in particular near-infrared windows even though its estimated overall effective temperature is slightly lower. Brightness at one wavelength is not a thermometer for the entire object. The openings in this reconstruction illustrate the idea; their shapes and locations are not measured weather features.

Reading the clouds in the spectrum.

Different wavelengths pass through different parts of the atmosphere. Researchers compare high-resolution spectra with models of gas absorption, temperature structure and clouds to work out which combinations fit the observations. A and B make a valuable paired experiment: neighboring brown dwarfs with different spectral appearances. Those models can test cloud properties, but a convincing fit is not an exact inventory of every atmospheric layer.

The glow slowly changes its character.

B radiates internal heat rather than maintaining a star’s steady core hydrogen fusion. As brown dwarfs age and cool, their atmospheric chemistry and outgoing light evolve. This is why a cool-looking cloudscape should not be mistaken for a habitable one: the depicted layers are still extremely hot and offer no breathable air. The long-term story is gradual fading, without a sunlike giant phase on the diagram.

Between planets and stars.

DIAMETER / SOL≈ 0.10 ×

About 10.0% of our Sun’s diameter.

Circles compare diameter, not mass or luminosity. Illustrative estimate: about one Jupiter radius, or roughly 0.10 solar diameters. A 2025 atmosphere study adopts 1 ± 0.1 Jupiter radii for both components as a model prior, not a direct radius measurement.

EFFECTIVE TEMPERATURE

Cooler than a star. Still searing.

  • Luhman 16 B≈ 1,280 K
  • Sol≈ 5,770 K

Shared scale: 0–10,000 K. Effective temperature describes total emitted energy per unit surface area; it is not the core temperature. Bolometric estimate from Faherty et al. (2014): 1,280 ± 75 K. The estimates for A and B overlap within their uncertainties.

LIFE PHASE

A cloudy world losing heat.

  1. ENERGYStored internal heat
  2. NOWCloudy atmosphere
  3. OUTLOOKCooling and fading

Brown dwarfs cannot sustain core hydrogen fusion like Sol. This describes their gradual cooling, not a stellar giant-stage sequence or a countdown.

Research · size and temperature ↗Research · radius estimates and models ↗
LIFE & HUMAN SURVIVAL / CLOUD LAYERS
POSSIBILITY FOR LIFEIncompatible with known life

The hot cloud layers depicted here are incompatible with known life. This describes these atmospheric layers, not every conceivable environment around a brown dwarf.

WITHOUT PROTECTIONNot survivable

No breathable air or solid ground. Intense heat and increasing pressure make descent into these cloud layers unsurvivable without protection; there is no single meaningful survival timer.

NASA · stellar structure and evolution ↗

A cloudy world losing heat.

  1. ENERGYStored internal heat
  2. NOWCloudy atmosphere
  3. OUTLOOKCooling and fading

Brown dwarfs cannot sustain core hydrogen fusion like Sol. This describes their gradual cooling, not a stellar giant-stage sequence or a countdown.

Research ↗

B radiates internal heat rather than maintaining a star’s steady core hydrogen fusion. As brown dwarfs age and cool, their atmospheric chemistry and outgoing light evolve. This is why a cool-looking cloudscape should not be mistaken for a habitable one: the depicted layers are still extremely hot and offer no breathable air. The long-term story is gradual fading, without a sunlike giant phase on the diagram.

How much energy leaves the star?

≈ 0.0000242 × Sol

This compares total radiant power across all wavelengths, not just visible light or apparent brightness in our sky. The beams on the dashboard share a linear length scale.

The estimate combines this log’s diameter ratio (0.1 × Sol) and effective temperature (1,280 K): luminosity scales with radius squared and temperature to the fourth power. It is derived from rounded values, not an independent luminosity measurement.

Illustrative estimate: about one Jupiter radius, or roughly 0.10 solar diameters. A 2025 atmosphere study adopts 1 ± 0.1 Jupiter radii for both components as a model prior, not a direct radius measurement.

Bolometric estimate from Faherty et al. (2014): 1,280 ± 75 K. The estimates for A and B overlap within their uncertainties.

Swinburne University · Stefan–Boltzmann law ↗

A map made without a close-up camera.

Astronomers used changing spectral lines as Luhman 16 B rotated to reconstruct large bright and dark regions. The result was an early weather map of a brown dwarf. It did not resolve individual clouds like a spacecraft camera would. Instead, the map inferred which broad regions contributed different amounts of light as they turned into view.

A gap can make a cool world brighter.

A thinner cloud layer can expose deeper, warmer gas. That helps explain why B can outshine A in particular near-infrared windows even though its estimated overall effective temperature is slightly lower. Brightness at one wavelength is not a thermometer for the entire object. The openings in this reconstruction illustrate the idea; their shapes and locations are not measured weather features.

Reading the clouds in the spectrum.

Different wavelengths pass through different parts of the atmosphere. Researchers compare high-resolution spectra with models of gas absorption, temperature structure and clouds to work out which combinations fit the observations. A and B make a valuable paired experiment: neighboring brown dwarfs with different spectral appearances. Those models can test cloud properties, but a convincing fit is not an exact inventory of every atmospheric layer.

The glow slowly changes its character.

B radiates internal heat rather than maintaining a star’s steady core hydrogen fusion. As brown dwarfs age and cool, their atmospheric chemistry and outgoing light evolve. This is why a cool-looking cloudscape should not be mistaken for a habitable one: the depicted layers are still extremely hot and offer no breathable air. The long-term story is gradual fading, without a sunlike giant phase on the diagram.

An imagined view of patchy cloud cover with warmer atmospheric layers visible through openings. Research supports brightness variations and cloud structure, not this exact arrangement. Color and exposure are illustrative.

Windows into warmer depths

An imagined view of patchy cloud cover with warmer atmospheric layers visible through openings. Research supports brightness variations and cloud structure, not this exact arrangement. Color and exposure are illustrative.

An imagined overhead view of cloud bands and turbulent filaments. This is not the published Doppler map: its detailed swirls are fictional. All visible structures are atmospheric, with no solid surface beneath the frame.

Weather without continents

An imagined overhead view of cloud bands and turbulent filaments. This is not the published Doppler map: its detailed swirls are fictional. All visible structures are atmospheric, with no solid surface beneath the frame.

An imagined atmospheric swirl on Luhman 16 B, seen from above. Cloud structure and color are hypothetical; enhanced exposure makes the layers visible.

An atmospheric whirl

An imagined atmospheric swirl on Luhman 16 B, seen from above. Cloud structure and color are hypothetical; enhanced exposure makes the layers visible.

Stellar images are artistic interpretations, not resolved photographs of this star.